

🤔 Why do we use Economic Statistics in our Writing?
To put it simply, students who use economic statistics provide credibility to their arguments. The HSC Economics course requires students to formulate arguments in response to short answer and essay questions.
Using statistics as supporting evidence proves two things to the marker:
-
The arguments you are marking are valid and have occurred in real life.
-
You have engaged with the course content and are reading beyond the syllabus.
It is a well-known fact that students who use statistics throughout their responses are rewarded with higher marks than those who choose not to. This is because markers do not have to deliberate as to whether a certain economic theory or concept is true - statistics provide the evidence that they are looking for.
Economic statistics help markers differentiate between correct and dubious claims, which can also assist students with weak theoretical knowledge to prove their point in a more efficient manner. Moreover, the HSC Economics syllabus and HSC Economics exam marking guidelines imply that statistics are needed to achieve top marks, as students are required to make a “well-informed judgement” - a judgement that require quantitative evidence.
Looking for a handy source of statistics? The HSC Economist articles published by Project Academy are a great source of statistics!
📊 Types of Useful Economic Statistics

1. Economic Objectives
The most versatile types of economic statistics are based on the six core economic objectives mentioned in the syllabus under Topic 3. These statistics can be used as supporting evidence in a variety of essays and short answer questions, particularly for essay questions based around statistics/changes in the Australian economy.
-
Economic Growth → Real GDP (quarterly and yearly)
-
Price Stability → Underlying Inflation Rate (quarterly/yearly)
-
Full Employment → Unemployment Rate, Size of Labour Force, Participation Rate, Underemployment Rate, Unemployed Persons, Youth Unemployment Rate
-
Distribution of Income and Wealth → Gini Coefficient (yearly figures)
-
Environmental Sustainability → Greenhouse Gas Emissions (quarterly and yearly)
-
External Stability → BOGS, Current Account Balance, NFD and NFL as a % of GDP, Exchange Rates, Terms of Trade, NPY Balance (quarterly/yearly figures)
2. Economic Development Statistics
- Human Development Index, Life Expectancy, OECD Index Rankings, Greenhouse Gas Emissions per capita
3. Fiscal and Monetary Policy Trends
-
Interest rates (monthly), including rationales for each cash rate movement
-
Size of Budget, Budget Outcomes and Fiscal Policy Stance, including rationales for each decision
-
Include specific policies from each Budget (preferably from the last ten years) with statistics
4. Free Trade Agreements
-
Number of countries participating and year created
-
Total exports that go towards countries involved in the agreement
-
% of GWP the FTA accounts for
-
% of protection removed between member nations in terms of trade in a particular industry
5. Global Economic Organisations and Forums
-
Number of countries participating and year created
-
Examples of specific policy decisions with related statistics
6. Case Study
When preparing for the Case Study, it’s important to consider Australia’s Economic Objectives in the context of your chosen country. For example, consider the rate of Real GDP in your chosen country or their level of Greenhouse Gas Emissions - Australia’s economic objectives are a great starting point when looking for statistics for your case study. This will ensure you can answer an essay question that asks you to compare and contrast Australia and an economy of your own choosing. It is also important to note down policies that your selected economy has implemented throughout history, which is a more common question in the HSC.
7. Other statistics
-
Household Savings Ratios
-
Export and import composition
-
Changes in the value, direction and composition of trade and financial flows
-
Minimum Wage
-
Composition of the Balance of Payments
-
Composition of Net Foreign Liabilities
📝 How Do I Organise my Economics Stats?

1. Reuse your Economics Statistics Across Topics!
I would encourage students to organise their economics statistics to specific years or time periods. Why? Because there are many statistics that can be used across a variety of topics and subtopics. For example, statistics about Australia’s historical current account deficit can be used in a Topic 2 essay (Balance of Payments), a Topic 3 essay (External Stability) and even a Topic 4 essay (Fiscal Policy). When you organise your statistics by time periods or years, you only have to memorise the statistics once and can reuse them where necessary.
When creating my own ‘Economics Statistics Sheet’, I stuck to these time periods and key concepts:
-
20th Century → Pre-2000s
-
Global Resources Boom → Mid-2000s
-
GFC → 2007-2009
-
Australian Mining Boom → 2010-2012
-
Post-Mining Boom Slowdown → 2012-2016
-
BREXIT and US-China Trade Tensions → 2016-2019
-
COVID-19 → 2020- (ongoing)
-
Future Projections and Predictions → 2025 onwards
2. Use both Recent and Historical Stats!
Students should prioritise recent time periods over historical data (i.e. more than ten years ago) as markers will often consider the data to be outdated and/or irrelevant. However, it is important for students to analyse some historical data, as it can be used as a reference point to highlight the importance of economic policies and targets. For example, comparing Australia’s 1980s inflation rate with its 2010s inflation rate demonstrates the effectiveness of the inflation targeting framework that Australia adopted in the early 1990s. Thus, by organising statistics by time periods, it allows students to make a more informed judgement that recognises the significant changes that have occurred in both the global and Australian economy.
✍️ How to Use Economic Stats in Your Writing
-
Write about how to use economic stats to maximise marks, maximise persuasiveness of arguments, etc
-
Provide a short answer question exemplar involving use of statistics
1. How to use stats
The fundamental rule of using economic statistics is that they should be used to support the argument a student is making, not to make the argument for them. With this in mind, I’d encourage students to use statistics after they make an argument and explain their argument - you don’t want to use a statistic too early! Statistics are meant to act as a ‘proof’ for the claim(s) that a student makes in their essays or short answer responses.
It is also wise for students to use two statistics from different time periods in the same sentence to show the effect of XYZ or to prove how an economy has transitioned. In the below example, I compare the level of income inequality that Australia had in 1997 to the level of income inequality that it has now. This statistic is effective because it shows that Australia has an ongoing problem with income inequality, which has increased since the 1990s. Notice that this statistic is not used to make my argument that the LMITO tax offset will improve income inequality, rather it is used to prove to the marker that there is a need for this policy and that the ‘likely impact on Australia’s economic performance’ is that it will resolve the issue mentioned in the statistic.
2. Short answer question example
“Outline one policy from the recent budget (2021/22) and assess its likely impact on Australia’s economic performance” (3 marks)
The continuation of the $7.8b low-middle-income tax offset will increase the disposable incomes of 10.2 million low-middle-income earners in Australia by limiting the rate of tax paid as a leakage. This will have a greater-than-proportional benefit for lower income households, improving the level of income inequality in Australia. For Australia, its current 0.323 Gini coefficient created a need for this policy, as Australia has seen a +0.026 rise in its Gini coefficient since 1997, signalling a deterioration of income inequality over the past 20 years. As such, this policy should also boost the purchasing power of high-MPC, low income earners, leading to stronger consumption levels and greater aggregate demand. This will create a derived demand for labour, limiting the rate of cyclical unemployment and improving economic growth in a broader attempt to reach the 3-4% growth goal set out in the 1997 Mortimer report.
In this exemplar answer, a real-life example, a statistic and additional extension material is used together to formulate a 3/3 response. As you can see, statistics are not used to make an argument in response to the question, rather to supplement the overarching argument that the LMITO tax offset policy will improve income inequality and boost economic growth in Australia.
Want access to a wide range of past papers for every subject? Sign up to courses at Project Academy to receive such benefits and more!
🧐 How Do I Find Stats for Economics?
When it comes to finding statistics for HSC Economics, there are a variety of useful sources available to students.
1. Past Papers
An underrated method of finding statistics for HSC Econ is sifting through past papers and analysing the source material included in each paper. Usually, Question 25 and 26 of every Economics past paper will include graphs, statistics and a quote from a famous economist. More often than not, these sources are highly relevant, contemporary information that can be incorporated into a number of essays for the HSC.
2. RBA Snapshots
Each month, the RBA will create a summary of ‘Key Economic Indicators’ and other assorted statistics that are highly relevant to the HSC course. These statistics will help you keep up-to-date with contemporary economic information, even if you look at it the day before your HSC Econ exam. The resource is easy to read and accessible to all.
3. ABS Key Economic Indicators
If you’re looking for a more detailed set of statistics that will cover all your bases for the HSC, head on over to the ABS website to look at their ‘Key Economic Indicators’ page. This page contains an extensive number of statistics that go beyond the syllabus and can be used as ‘extension material’ to include in essays.
4. Project Academy
If you enrol as an Economics student at Project Academy, we offer a number of valuable resources and statistics that align to every single syllabus dot-point. Teachers will go out of their way to research and discover additional statistics and examples that can be incorporated into short-answer questions and essays. Joining the Economics cohort at Project will give you access to these valuable insights and the multitude of resources we have available.
5. The ABC News Kohler Report
If you’re running out of time before your Economics exam and need to memorise a few additional statistics, head on over to Alan Kohler’s daily finance report on the ABC. Not only is the information contemporary, but the report provides an explanation to each statistic and trend, which can also be incorporated into essays and short answers.
🕵️ What Other Things Should I Look Out For?
1. Diagrams
To complement your statistics, diagrams are a great way to represent certain concepts or ideas visually. Markers love diagrams because they are visually appealing and they allow the marker to ‘take a break’ from pages of handwriting. When drawn properly and referenced throughout the adjacent paragraph, diagrams are a highly effective way of obtaining additional marks for your essays.
2. Mathematical Derivations (Extension)
If you want to extend yourself beyond diagrams and statistics, you may wish to use mathematical derivations to prove that a certain economic theory is valid. For example, when explaining the Twin Deficit Theorem, it may be wise to deconstruct the circular flow of income. This will help you prove that a budget deficit is commonly associated with a current account deficit - a historical, causal relationship in Australia.
At equilibrium, Injections = Leakages
Investment + Government Spending + Exports = Savings + Taxation + Imports
I + G + X = S + T + M
(I - S) + (G - T) = (M - X)
Savings-Investment Gap + Budget Deficit = Trade Deficit (CAD)
This mathematical derivation proves the causal relationship between a budget deficit and a current account deficit, validating the argument in a logical fashion.
📈 Types Of Diagrams
- Recommend a couple, e.g. Supply vs Demand, e.g. tax diagram, e.g. price floor/ceiling, e.g. subsidy graph, production possibility frontier, etc
-
Supply and Demand Graphs
-
Appreciation and Depreciation Graphs, e.g. J-Curve Diagram (appreciation, depreciation)
-
Protection Graphs (tariffs, quotas, subsidies)
-
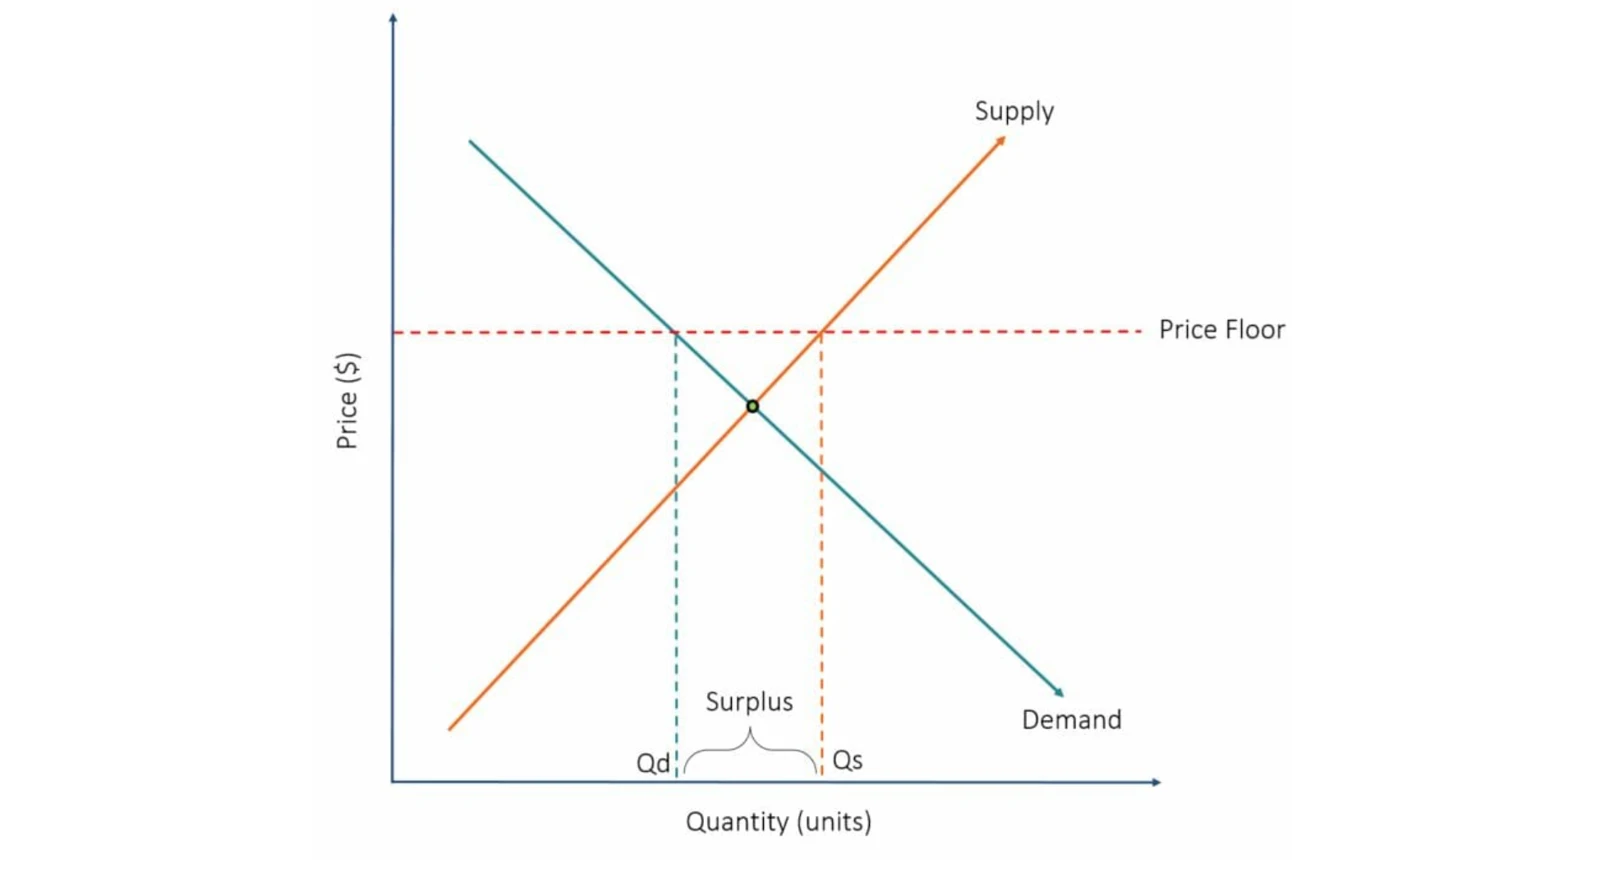
Price Floor and Ceiling Graphs
-
Negative and Positive Externality Graphs
😮 How And When To Use Diagrams
1. In Essays
Diagrams should be used to illustrate difficult concepts in a simple fashion. For example, students may struggle to explain how the Carbon Tax internalises negative externalities and shifts the Marginal Private Cost curve to meet the Marginal Social Cost curve. However, a clearly labelled diagram will help markers identify the intended effect of the Carbon Tax and can be used as a point of reference to supplement an otherwise difficult explanation.
The average student will typically take around 1-2 minutes to construct a diagram in their economics essay. Therefore, students need to be judicious in their selection of appropriate diagrams and the amount of diagrams they decide to use.
Personally, I limited the number of diagrams per essay to 3. I did this for two reasons:
-
To give myself additional time for explanations, references to the diagram and other areas of the exam paper that were incomplete.
-
To prevent myself from going overboard with unnecessary diagrams that added little to no value to my essay.
Students should use diagrams at their own discretion, but should know that too many diagrams will detract from the quality of their essay and will not necessarily provide them with additional marks. If you need some examples of how to use diagrams, exemplar past hsc exam papers are a good source of well-written essays with well-executed diagrams!
For tips with economics essay writing, read this article!
2. In Short answer questions
Students should avoid using diagrams in short answer questions. Not only do diagrams take up the limited space given to answer short answer questions but they are hardly effective unless they can be properly deconstructed. If you are unsure as to whether you ‘wrote enough’ to achieve full marks in a particular question and you have additional time left over, including a diagram may be worthwhile to secure those missing marks. However, only include diagrams that are relevant to the question and meaningful.
🎨 How To Draw Diagrams
-
Draw the X and Y axis, label them (approx. a third to a quarter of the page)
-
Label the curves and draw them accurately
-
Create points of reference on the X and Y axis (i.e. real stats)
-
Include arrows and show a movement on the graph
-
Annotate or scribble where necessary
-
Include a title and reference it!
🙋 FAQs
These are things commonly searched on google, write 50-80 words per response in an interesting way that reflects your understanding of the course and what you think would be useful for students.
1. Is Economics hard for the HSC?
Conceptually, some would argue that Economics is difficult. However, students who apply their theoretical knowledge to practical study methods, such as past papers, do not find the subject as challenging. Students who engage with the content, read beyond the textbook and prepare accordingly for Economics will not find the subject difficult.
2. What is the best HSC Economics tutoring in Sydney?
Project Academy has achieved four Economics state ranks from 2020-2021. These results are a testament to the close-knit community and the supportive Project staff. Each tutor at Project is an expert in their respective subject and can guide every student to their academic goals. Project’s application-based learning style and exam program (LEAP) has helped its Economics students to routinely achieve high Band 6s every year alongside state ranks.
3. How does Economics scale in the HSC?
Economics is often labelled a ‘high-scaling’ subject due to the complex nature of concepts and ideas introduced in the course. Students who undertake Economics as an HSC subject and perform well in the course are likely to see a significant boost to their ATAR. But most importantly, don’t do Economics just for the scaling — you need to make sure you would actually enjoy the subject!
4. Where can I find year 12 Economics notes?
If you are unable to find notes for Economics, I would encourage you to look through Project Academy’s website to locate additional resources made by state-ranking tutors. Whilst notes are important, it’s also important to consolidate your knowledge via past papers and practice questions. These can also be found on Project’s website.
5. How do I make HSC Economics notes?
The best way to make HSC Economics notes is to use the syllabus dot points as a guide, using in-class resources, textbooks or alternative resources to note down important concepts and ideas under each dot-points. As tempting as it is, it is highly inefficient to write down absolutely everything you can find under each dot-point. Use your own discretion to differentiate between what is important and what isn’t - this will make your note-taking more efficient and effective.
6. What are the best year 12 Economics textbooks?
Most HSC Economics teachers will use Tim Riley or Tim Dixon’s textbook. However, in my honest opinion, textbooks are prone to containing irrelevant information and have a tendency to over-explain and complicate simple concepts. I did not use a textbook in Year 12 and relied on Project Academy’s resources when I was a student there.
7. Is Year 12 Economics similar to Year 11 Economics?
Year 11 Economics focuses on microeconomics, whereas Year 12 Economics focuses on macroeconomics. Most concepts learnt in Year 11 are expanded on in Year 12. A strong foundational knowledge in Year 11 will certainly help students excel in Year 12. Some would argue that Year 12 Economics is considerably more enjoyable than Year 11 Economics due to its real-world application.
8. How do I study for HSC Economics?
To put it simply, students should prioritise their understanding and avoid memorising HSC Economics content. Students should write a detailed set of notes using the syllabus as a guide but should not rely on notes as their only form of study. By completing past exam papers and practice questions in conjunction, students will apply their knowledge to questions that could appear in their HSC exam, allowing them to isolate aspects of the syllabus that they struggle with and to work from there.